
In our Medium-Term Management Plan 2028, "Sustainable + Spiral (Sustainable Positive Spiral)" (FY2026 - FY2028), we have set the creation of a sustainable positive cycle (Sustainable + Spiral) as our theme. As consolidated KPIs for FY2028 (fiscal year ending March 31, 2029), we have set targets of sales of ¥110.0 billion, operating profit of ¥3.0 billion, and net profit attributable to parent company of ¥2.0 billion, as well as a target of ROE of 8% or higher as a capital profitability indicator.
Furthermore, we have set the cost of equity and WACC (Weighted Average Cost of Capital) as capital costs to evaluate and verify our capital profitability performance. Regarding our stock price, we are striving to ensure that our growth potential is fairly and sufficiently evaluated by the market through active dialogue with shareholders and investors, the dissemination of our medium- to long-term growth strategy, and further enhancement of disclosed information.
In our Medium-Term Management Plan 2028, "Sustainable + Spiral (Sustainable Positive Spiral)," we have set capital efficiency targets for FY2028 and outlined our policies to improve investment and shareholder returns based on capital efficiency and growth, while also demonstrating a strong focus on capital cost and stock price in our management
|
Theme |
Creating a sustainable positive cycle (Sustainable + Spiral) |
|
Positioning |
Three years to put growth on track |
|
Basic Policies |
(1) Promote management conscious of cost of capital and corporate value •Transform the business portfolio by capturing social issues and growth potential •Continue proactive shareholder returns through progressive dividends |
|
(2) Create a positive cycle of investment •Improve returns by expanding group synergies •Continue strategic investments on the scale of ¥10.0 billion |
|
|
(3) Sustainable production of valuable human assets •Establishment of a foundation for producing valuable human assets through diverse career paths •Implement growth support systems and execute investment |
|
FY2028 Important target index |
FY2028 Targets |
|
Net sales |
¥110.0 Bn |
|
Construction Supply |
¥73.0 Bn |
|
Industrial Materials |
¥22.0 Bn |
|
Electronic Devices |
¥15.0 Bn |
|
Operating profit |
¥3.0 Bn*1 |
|
Construction Supply |
¥2.7 Bn |
|
Industrial Materials |
¥1.4 Bn |
|
Electronic Devices |
¥0.5 Bn |
|
Profit attributable to owners of parent |
¥2.0 Bn |
|
ROE |
8% or more |
|
Investment quota |
¥10.0 Bn*2 |
|
Shareholder Return Policy |
Progressive dividend +Flexible purchase of treasury shares |
*1 Adjustment of 1.5 billion yen is added to the total for each segment (the adjustment is made to eliminate inter-segment transactions and company-wide expenses not allocated to each reporting segment)
*2 Cumulative total for FY2026-FY2028
|
FY2023 |
FY2024 |
FY2025 |
FY2025 Important target index*1 |
|
|
Net sales |
¥90.1 Bn |
¥94.5 Bn |
¥90.6 Bn |
¥110.0 Bn |
|
Construction Supply |
¥58.1 Bn |
¥61.0 Bn |
¥58.4 Bn |
¥70.0 Bn |
|
Industrial Materials |
¥17.1 Bn |
¥17.9 Bn |
¥17.9 Bn |
¥20.0 Bn |
|
Electronic Devices |
¥14.7 Bn |
¥15.5 Bn |
¥14.2 Bn |
¥20.0 Bn |
|
Operating profit |
¥1.74 Bn |
¥2.12 Bn |
¥2.10 Bn |
¥2.6 Bn |
|
Profit attributable to owners of parent |
¥4.83 Bn |
¥1.56 Bn |
¥1.22 Bn |
¥1.9 Bn |
|
ROE |
22.4% |
6.6% |
5.2% |
8% or more |
|
ROIC |
4.2% |
4.4% |
4.0% |
6% or more |
|
Total return ratio |
40.4% |
100.2% |
133.5% |
100%*2 |
|
Investment quota |
¥9.8 Bn*3 |
¥13.7 Bn*4 |
¥14.7 Bn*5 |
¥15.0 Bn*5 |
*1 Updated Medium-Term Management Plan Sustainability V (Value) for FY2024-FY2026 (Disclosed December 14, 2023)
*2 Change in Shareholder Return Policy in Medium-Term Management Plan Sustainability V (Value) (Disclosed August 8, 2024)
*3 Cumulative total for FY2021-FY2023
*4 Cumulative total for FY2021-FY2024
*5 Cumulative total for FY2021-FY2025
|
The previous medium-term management plan, Sustainability V (Value)(FY2023 - FY2025) |
|
|
◇Profit |
|
|
◇ROE |
In the final year of the medium-term plan (FY2025), ROE decreased by 5.2%, a 1.4% decrease compared to the previous year, due to a decline in net income attributable to parent company shareholders. Due to the rise in the risk-free rate, the cost of equity increased. ROE fell below the cost of equity (equity spread -1.6%). |
|
◇ROIC |
In the final year of the medium-term plan (FY2025), operating profit decreased slightly year-on-year, while invested capital increased due to strategic investments, resulting in a 4.0% decrease in ROIC compared to the previous period, down 0.4% year-on-year. Our market capitalization increased, the ratio of shareholders' equity to interest-bearing debt rose, and WACC increased due to the rise in the risk-free rate. ROIC fell below WACC (EVA spread -1.0%). |
In FY2023, the company implemented a review of its asset allocation through the sale of real estate, resulting in a gain on the sale of fixed assets of 4,773 million yen. Consequently, net income, equity, and ROE all increased significantly.
|
FY2020 |
FY2021 |
FY2022 |
FY2023 |
FY2024 |
FY2025 |
|
|
ROE (%) |
5.9 |
7.2 |
8.3 |
22.4 |
6.6 |
5.2 |
|
Profit attributable to owners of parent (Millions of yen) |
1,000 |
1,296 |
1,585 |
4,832 |
1,566 |
1,225 |
|
Net assets (Average during the period, Millions of yen) |
16,930 |
17,965 |
19,008 |
21,559 |
23,751 |
23,546 |
|
ROIC (%) |
5.1 |
5.2 |
5.0 |
4.2 |
4.4 |
4.0 |
|
Cost of equity (%) |
5.9 |
6.2 |
5.6 |
5.7 |
5.0 |
6.8 |
|
WACC (%) |
4.4 |
4.0 |
3.9 |
4.5 |
3.5 |
5.0 |
-
As a result of steadily implementing initiatives based on the basic principles of our previous medium-term management plan, Sustainability V (Value), our PBR has risen to over 1.0x.
-
We recognize that there is still a gap between our current performance and market expectations, and we will continue to work on profit growth measures and capital productivity improvement measures.
|
The previous medium-term management plan, Sustainability V (Value) (FY2023 - FY2025) |
|
|
◇ Market capitalization |
|
|
◇ PBR |
|
|
FY2020 |
FY2021 |
FY2022 |
FY2023 |
FY2024 |
FY2025 |
|
|
P/B ratio (Times) |
0.46 |
0.55 |
0.67 |
0.94 |
0.93 |
1.19 |
|
ROE (%) |
5.9 |
7.2 |
8.3 |
22.4 |
6.6 |
5.2 |
|
P/E Ratio (Times) |
8.0 |
7.8 |
8.2 |
4.6 |
14.0 |
22.5 |
|
Market capitalization (Millions of yen) |
8,011 |
10,122 |
12,998 |
22,078 |
22,283 |
27,632 |
|
Net assets (Millions of yen) |
17,454 |
18,477 |
19,539 |
23,578 |
23,924 |
23,169 |
- Achieve ROE target of 8.0% or more and ROIC target of 6.0% or more in the final year of the previous medium-term management plan, Sustainability V (Value) (fiscal year ending March 31, 2026 (FY2025)).
- Steadily implement initiatives based on the basic policies of the previous medium-term management plan, Sustainable V (Value) to improve P/B ratio, and strive to increase corporate value through profit growth and capital productivity improvement.
・PMI execution and monitoring
Accelerate the return on investment and raise Group profits through implementation and appropriate monitoring of PMI measures for the four main M&As implemented.
・New investment in strategic areas (M&A, new businesses, plant and equipment investment, etc.)
We will expand our investment framework (15 billion yen over five years, from FY2021 to FY2025) and implement new investments that prioritize capital efficiency and growth based on our capital allocation policy (14.7 billion yen in investments over five years).
・Restructuring of Industrial Materials Segment
Through measures such as the acquisition of a subsidiary for our industrial materials business and the reorganization of group companies, we have improved the growth potential and capital return of our industrial materials business and reviewed our business portfolio.
・Achieving both growth and shareholder returns
Shareholder returns based on a consolidated dividend payout ratio of at least 80% and a policy of 100% total return ratio (including share buybacks ).
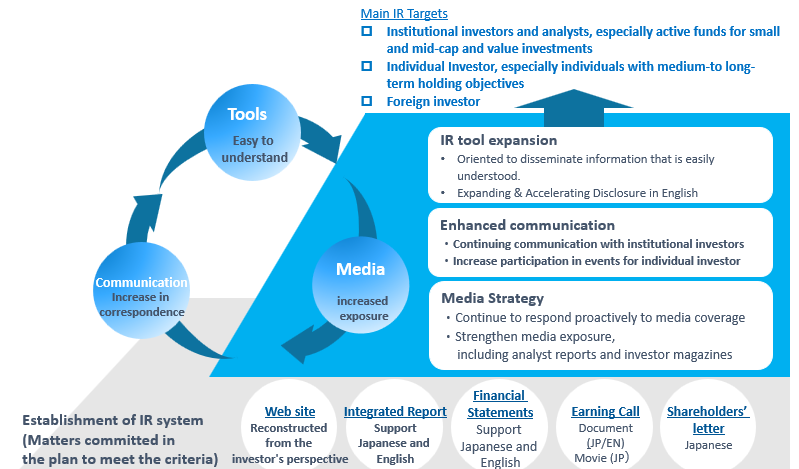
・Enhancement of various IR tools /Strengthen information disclosure to foreign investors and individual investors, and dialogue with shareholders
Expand opportunities for investor communication through participation in investor events and efforts to increase awareness through the use of mass media for investors.
・Reduction of policy shareholdings
Reduction toward a net asset ratio of less than 10.0%. We continued to sell off our strategically held shares until FY2025.
- In the previous medium-term management plan, Sustainability V (Value), the investment framework was expanded to 15.0 billion yen over five years. From FY2021 to FY2025, a cumulative investment of 14.7 billion yen has already been made.
- We will continue to make aggressive investments by actively utilizing external funds (such as interest-bearing debt) and cash through asset allocation.
|
FY2021 - FY2025 |
|
|
M&A (Included M&A Consideration Costs) |
¥10.58 Bn |
|
New Energy Distribution System Inc.(December 2022) Sinbou Edix Co., Ltd.(December 2022) Gansui Corporation(June 2023) Sanwa Holdings Co., Ltd.(February 2025) |
|
|
Plant & equipment (Investment in maintenance, renewal and enhancement of own plants and facilities) |
¥2.60 Bn |
|
Human assets, IT & others (Recruit/Engagement Survey Core system renewal Enhancement of IR) |
¥1.53 Bn |
|
Invested ammount |
¥14.71 Bn |
Strengthening Capabilities in the Solar Power Market through M&A
|
Our Group's Capabilities in the Photovoltaic Power Generation System Market |
Residential |
Distribution |
Takashima & Co., Ltd. |
|
Installation |
New Energy Distribution System Inc. |
||
|
Industrial |
Distribution |
Takashima & Co., Ltd. |
|
|
Installation |
Sanwa System Co., Ltd. |
Basic policy on shareholder return
- Our basic policy on shareholder return is to increase investment in growth, aiming to become a company of sustainable growth with strategic investment, while at the same time, we will return profits to shareholders with an awareness of capital efficiency.
Medium-term Management Plan “Sustainability V (Value)
- Shareholder returns based on a consolidated dividend payout ratio of at least 40% and a 50% total return policy (including share repurchases and cancellations)
- Based on the recognition that further improvement of capital efficiency is necessary to achieve ROE of 8% or higher, we have decided to change the shareholder return policy of a dividend payout ratio of 80% or higher and a total return ratio of 100%, which were previously set under Sustainability V (Value).
*The Company conducted a stock split on October 1, 2023 at a ratio of four shares to one common share, and on October 1, 2025 at a ratio of two shares to one common share.
Dividends per share are the amounts taking into account the stock splits.
- Expand opportunities for investor communication by exhibiting at investor events and using mass media for investors to raise awareness
Breakdown of the number of shares by investor type
(End of March 2026)
IR strategy
- FY2023: Sell all financial institution stocks (4 stocks)
- FY2024: Sell trading partner stocks (3 stocks). Cross-shareholdings to net assets ratio is 9.9%
- FY2025: Sell trading partner stocks (1 stock). Cross-shareholdings to net assets ratio is 2.9%
|
Policy stock |
FY2020 |
FY2021 |
FY2022 |
FY2023 |
FY2024 |
FY2025 |
|
|
Shares other than unlisted shares |
Number of Company |
18 |
18 |
18 |
14 |
11 |
11 |
|
Balance sheet amount (Millions of yen) |
2,936 |
2,697 |
2,462 |
2,629 |
1,883 |
196 |
|
|
Shares of unlisted shares |
Number of Company |
22 |
22 |
20 |
21 |
22 |
22 |
|
Balance sheet amount (Millions of yen) |
147 |
147 |
137 |
187 |
487 |
487 |
|